
Error Bars are commonly used in the Life Sciences industry and also in research studies and experiments. However, the use of Error Bars is much wider. Error Bars can be used in any data table to show approved ranges of values compared to actual values.
For example, assume a sales manager in a company wants to compare the previous quarter's forecast to actual revenue for his staff. He wants to investigate any situation where the actual revenue was more than 20% above or below the forecast. If the forecast was within the acceptable range of tolerance, no further investigation was needed. If the revenue was more than 20% above or below, he needed to investigate why the forecast was off so much.
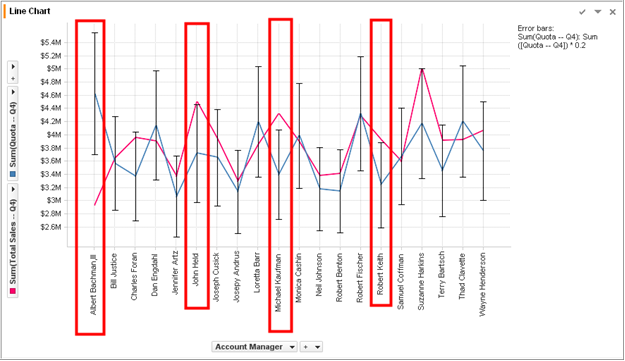
So, the sales manager uses Spotfire to plot his data using a Line Chart. There are two lines displayed, one for the forecast and one for the actual of all the salespeople. Error Bars where then added to the Forecast line, with the upper value set to 20% and the lower value set to 20%.

We can now see clearly which salespeople fell outside the acceptable range. If the line representing the actual sales numbers is not within the error bars, then we need to investigate further.
This is automatically setup as a template, meaning, the sales manager can easily load in new data at the end of the quarter and the plot will automatically be configured with the correct error bars. If you plan on using the 20 % in other plots in the analysis, it would make more sense to store this 20% inside a Document Property (see our tip on Global Variables).